Determination of weather conditions for paragliding
Weather, the thought of it does not leave flying people for an hour.
What it will be tomorrow or the day after tomorrow or in a week is very important. Indeed it depends on whether we will fly high and far. Especially if the place of flights is at a considerable distance from the place of permanent deployment. You need to know whether it is worth going on a journey of hundreds of kilometers and whether there will be complete disappointment awaiting us from the impossibility of paragliding. After all, everything may not be the way we planned. God forbid rain or wind at an insane speed. Perhaps the inversion will not rise high enough and will not allow the development of thermal flows.
Pioneers of Paragliding, as they say, planned the weather by eye and the sensations on the index finger. Today everything has changed. The developed Internet and information technologies for collecting, analyzing, and compiling weather models based on data obtained directly from space allow us to know with high accuracy which Paragliding weather expects us.
Knowledge of Paragliding must necessarily include the basics of meteorology, this is how and for what reasons there are changes in the atmosphere. This knowledge helps to correctly interpret the information received, the forecast on the state of weather conditions on a given day.
Here we will not expound on the theory of meteorology which you can study in such books as: "Understand the Sky", "Paragliding" and others. Pay attention to efficiency. The task, when viewing the available forecasts, in the shortest time, is to understand whether to hit the road or not, when and what will await us.
Getting Predictions
Below we describe how to use weather sites to correctly evaluate the forecast and select the appropriate location for the best flights.
Basic data needed
Wind direction and speed near the ground and at altitude.
Cloudy, precipitation. The possibility of overdevelopment.
Cloud base, inversion conditions.
The onset and duration of thermal conditions.
"Hardness" of the weather, the probability of critical conditions.
Sources of Forecasts
Windguru.cz
hmn.ru
NOAA.
The main source of forecasts can only be the website Windguru.cz. The site provides several types of forecasts with a set of necessary data. Only the GFS forecast is available in the free version, but this forecast is quite enough. The list of places is already quite wide. But if you did not find the one you are interested in, it is possible to indicate exactly your place by GPS coordinates.

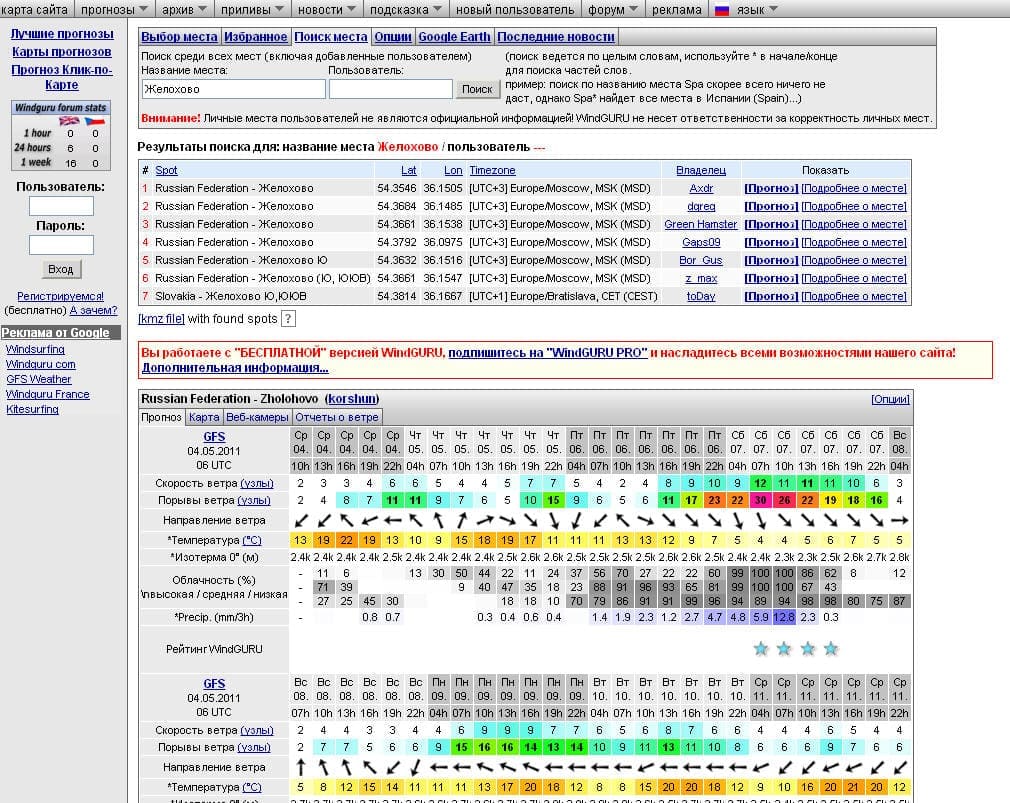
If there is a difficulty with knowing the coordinates or there is no desire to create your place, you can use the search for "Personal places" with other users of this site.

More accurate forecasts for personal places based on data without delay can be obtained in the paid version (~ 20 euros per year), which will increase the accuracy of the forecast for the next day. It is possible to use the paid version by a group, having a common username and password.
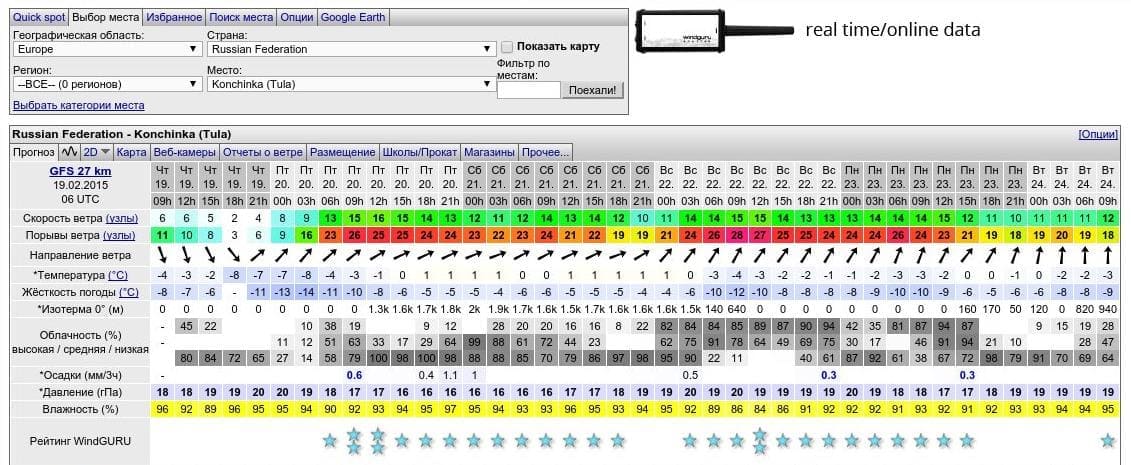
We choose a place, we look at the forecast of GFS.

When adding locations in the PRO version, forecasts for WRF 9 and 27 km models are added.
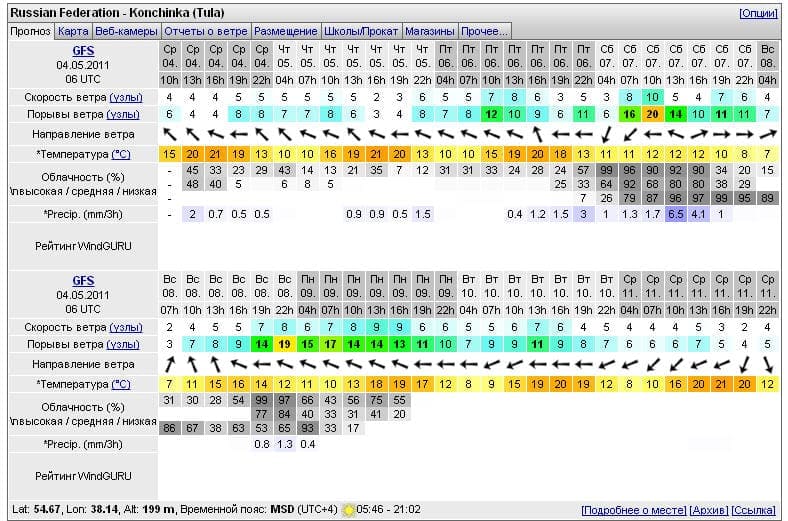
At the bottom of the forecast, you can see the coordinates of the place, altitude, and time of sunrise and sunset.
The left column indicates the type of forecast model and what data was used for it (in the picture 00.00.00 00 hours UTC).
Wind speed, units are changed with a click of the mouse. By default, the speed is specified in nodes, this is m / s = nodes / 2.
Gusts of wind near the ground.
Wind direction near the ground.
Surface air temperature
Isotherm at which the air temperature will be 0.
Cloud cover, and sky coverage at three levels in percent.
Precipitation in mm3 / h.
Rating - for surfers.
Paying attention to the temperature and its difference in the morning and afternoon hours, we can understand how strong the soaring conditions will be, the greater the difference, the “stronger”. We also pay attention to the isotherm height parameter, to the difference in data from previous days. If the zero point reading decreases, then the conditions improve, especially if the temperature at the ground remains unchanged. But no need to focus on isothermal data. Windguru provides basic and main information about the wind, what its strength, direction, and change throughout the day. Information on cloud cover and precipitation can also be considered secondary. Possible overdevelopment of the weather can be determined by insignificant precipitation (0.2-0.4 mm) with a cloud cover of less than 50%, this should not be feared.
For example in the above pictures. Thursday is good weather, moderate east wind, after lunch the clouds will begin to cover the sky, and it is possible over development with rain, such a day will be considered a flying day, Friday is already worse, there are a lot of cloud cover, the wind and rain are stronger. On Saturday the front will pass - a strong wind, rain, and the sky is overcast. After the weather improves, but this is a long-range forecast and its reliability is low, it is only important to note that the temperature will drop significantly.
As a result, having understood that the wind is flying and the cloudiness is not 100% with heavy precipitation, we go to the next site to find out more precisely about the cloudiness condition and the probability of rain that may be caused by front-line movement of the air masses and double-check the data in the wind. For these purposes, we will use domestic forecasts, preferably observing cloudiness and precipitation maps. There are such cards on Windguru, but they are a little specific to perception. We suggest using the site HMN.ru, the site has a convenient interface and visual maps.
On the site HMN.ru, select the nearest settlement and look at a brief forecast. Thursday - heavy rain with a thunderstorm, Friday - rain again, Saturday - possibly the sun, short rain. It is clear that Saturday is the best day, but the wind is strong - 6 m / s. A brief forecast will not tell us much, go to "5 days in detail."
In this form, the data is divided into morning, afternoon, and evening. Here you can better see the parameters of wind and clouds with precipitation. We estimate the correlation of the wind direction and strength with the forecast from Windguru. Provided that the forecast reading is more than 5 m / s, then the Paragliding weather is more likely to fly is non-flying. It would be normal 2-3 m / s for the field and 4-5 m / s for the hills. On this site, you need to evaluate the likelihood of rain, check the strength and direction of the wind, and see the temperature change and its difference between day and night. Particular attention will be paid to moisture near the ground. At low humidity, the base is higher and less likely to develop thunderstorms, but remembering that humid air is lighter, especially low humidity indicators will mean weak flight conditions.
If humidity is more than 70% and rains, such days will be cloudy. In other cases with a humidity of 55-60%, the probability of precipitation of local nature and the weather, in general, can be as good as on Thursday, but if high humidity is indicated, then with the same pictures, most likely the rains will be very real, and the cloudiness will be continuous as on Friday.
Ideal pictures would be - partly cloudy, partly cloudy with occasional rain, and clearly. By clicking on the icon in the upper right, you can see the actual weather data. Next, we double-check the information obtained by studying cloud maps. Click on the sign “weather maps”, select “precipitation and cloudiness”, select the day and time, see what cloud cover depends on the time, and analyze the possible dynamics of the weather.
image7
The map shows the trajectory of the passage of fronts, and cloud masses with all the resulting precipitation and the sky tightness. You can also see a map of winds at an altitude of 10 meters.
image8
And the likelihood of a thunderstorm.
image9
Determination of soaring conditions
After analyzing the two sites, one can already guess what kind of Paragliding weather will be, good or not. Will the wind be favorable for flights and will there be no precipitation unnecessary to us? It remains only to determine whether the appropriate conditions for soaring will be, how good they will be, and whether they will develop throughout the day. Define certain parameters of the values that they can achieve. Of these: are the strength of thermal flows and their height, the cloud base, the change in wind at a certain height, the temperature at the base level, the presence of inversion layers of air, and so on. For understanding, we will use reading upper-air diagrams. A lot has been written about how to read and interpret them both in print media and the "Answers to Questions" sections of Paragliding forums.
On these issues, it is convenient to use two sites: meteo.paraplan.net and NOAA.
On the site meteo Paragliding you need to once again check the forecast for wind, precipitation, humidity, and cloud cover with one glance. And go to the tab “Aerological chart”.
image10
First, we look through the entire chart to heights of 12,000 meters.
image11
Pay attention to the possible altitude clouds, it can affect the degree of warming. After that, follow the link “6000m” and inspect the chart in more detail. In the presented diagram, the weather is quite good, since the main front has not yet approached.
image12
It is much worse if the frontal masses are already nearby.
image13
The main thing that is important in the diagram is the slope of the temperature graph - the red curve shows whether there are inversions and how the graph slope changes depending on the height. This will mean that the upward development of the clouds will be limited. The diagram shows when the temperature changes by the evening and how much in the morning the air warms up to destroy the surface inversion caused by radiation cooling. to determine the height of the base, use the knowledge from the literature on this subject. Then you can easily identify it on the chart by eye. It is also very important to pay attention to information about the wind at one or another height. The wind direction diagram is indicated by blue arrows.
Finishing data
The extreme and most accurate forecast element is obtained on the NOAA website.
Enter the coordinates of the desired place.
image14
We choose the type of forecast: Sounding - diagram, stability time-series - a brief forecast of atmospheric instability, which means the height of mixing - that is, the height and strength of the heat flow.
image15
Select in the menu and see "stability time-series", and specify the forecast depth from 0 to 192 hours. After we select the starting point of the forecast and the duration of the forecast.
image16
Enter the verification code and get the schedule.
image17
The mixing height scale is on the left, the display is in red, the bottom is the time scale in UTC, and the scale on the top is the thermal class, the chart will indicate the level of instability and stability. A - bomb, thunderstorm conditions, the probability of a tornado, B - excellent, C - normal, D- weak. The turbulence characteristics of the atmosphere and the vertical mixing coefficient display a blue graph, under normal conditions, the blue graph is usually below the red. The red graph determines the height of mixing and does not show the exact height of the base the base is lower because the air is mixed in the cloud, and thunderclouds do not affect the height of the base. The graph looks clear, but it is not very indicative. So when passing fronts and in the rain, mixing also occurs and instability is observed, but at the same time, the Paragliding weather is non-flying. So go back and open the Sounding diagram.
image18
Again, select the forecast start point, depth (duration), type of animation, forecast height - only 400mb, to what pressure - 400 mbar, graph resolution, and enter the verification code. And we will see the same diagrams as on the meteo Paragliding net, but a little in a more convenient form.
image19
image20
We will write more about how to read such a diagram in an additional article. In the meantime, read the description on the forum Paragliding4.me.
We recall once again that the height of the base is quite easy to determine from the projection data of the dew point at the surface of the earth, this graph is displayed by a green line, and the temperature curve is shown in red along the isotherm line. The height of the cloud can be determined from the inversion line when the temperature gradient decreases sharply. According to data reflecting a drop in temperature of the dew point, which means a drop in humidity. Also when analyzing data from different sites, consider the UTC correspondence, and add 2 hours on the NOAA website for Europe. And do not miss the wind altitude information.
Remember, the diagram describes the situation for a specific time, having studied a couple of diagrams, you can find out almost complete information about how weather conditions will change during the summer day and what else can be expected from the weather.
To continue, stay tuned!

